Client Segmentation Report Guide
- OVERVIEW
This guide will demonstrate how to generate and edit the Client Segmentation Report from Xplan. The reporting period will automatically be the past year from today’s date by default.
1.1 How to generate your report from Xplan
- Generate a list of clients to report on
- Select Reports -> Merge Report
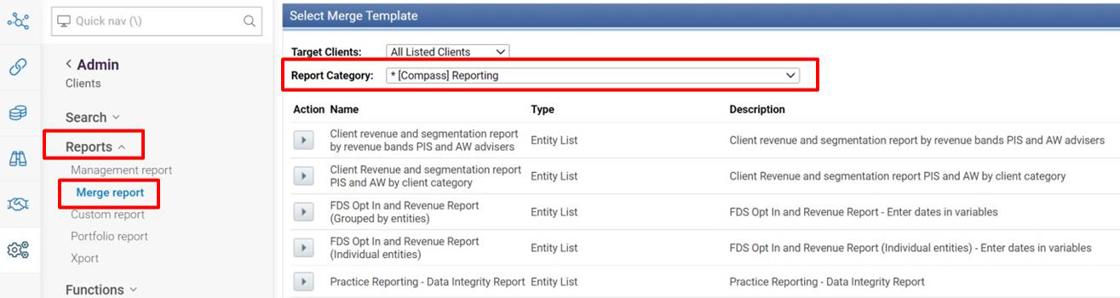
- Select Report Category *[Compass] Reporting or *CWT - Reports
- Click on the
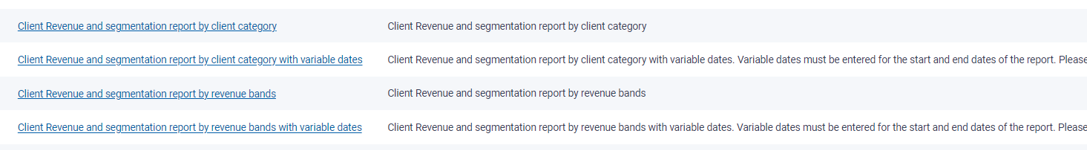
 button to choose the Template Name, in this example we select “Client Revenue and Segmentation Client Category". There is also a 2nd version of the report which splits the clients into revenue bands e.g 0-$1,500, $1,500-$3,000 etc
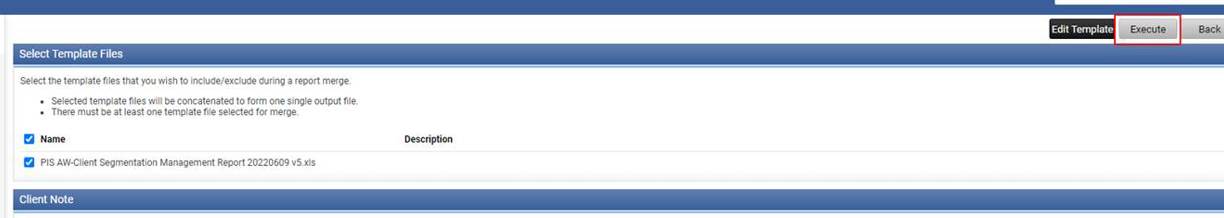
- Tick the report to run
- Click the Execute button
- Wait for the report to The Notification will appear on the bell icon, then click on it to download the report. The report may take up to 2 hours to run depending on the size of the practice.
1.2 Editing the Excel report to update graphs
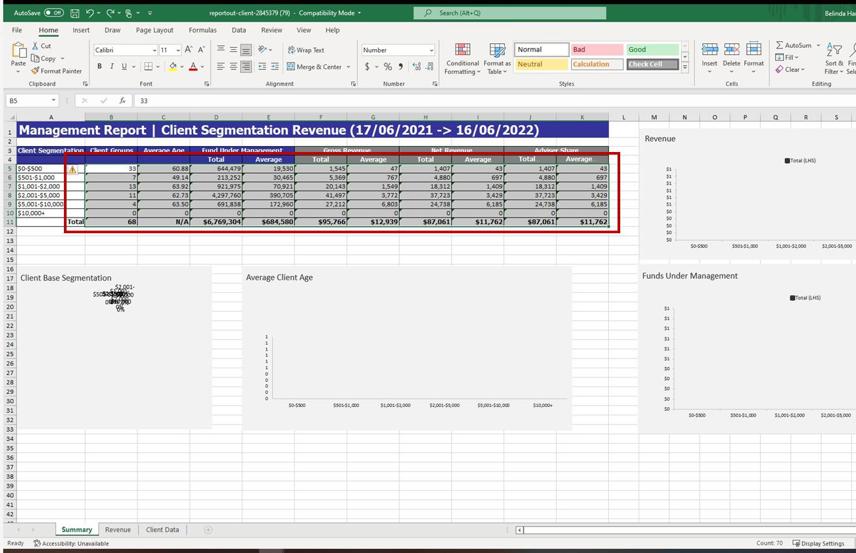
- Open the Excel report and click on the first worksheet tab, the Summary
The Clients included on this tab are segmented by bands of dollar values. There are 4 graphs that will be updated once the figures have been converted.
NOTE: You may need to click on a Microsoft warning at the top of your screen to enable editing.
- We need to highlight all of the cells in the content of the table including the totals, but not the dollar
- Once the cells are highlighted, click on the little warning triangle shape and choose “Convert to Number” from the list.
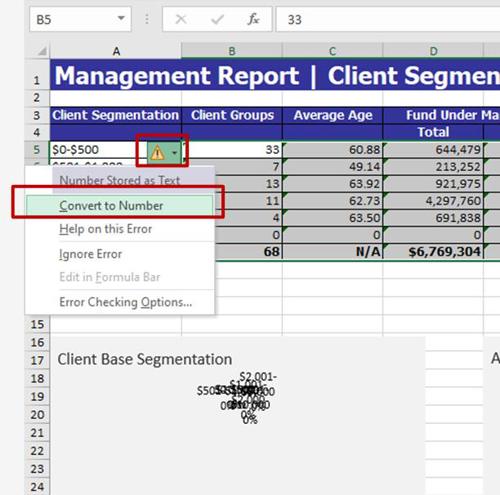
The graphs will now be updated on the Summary tab.
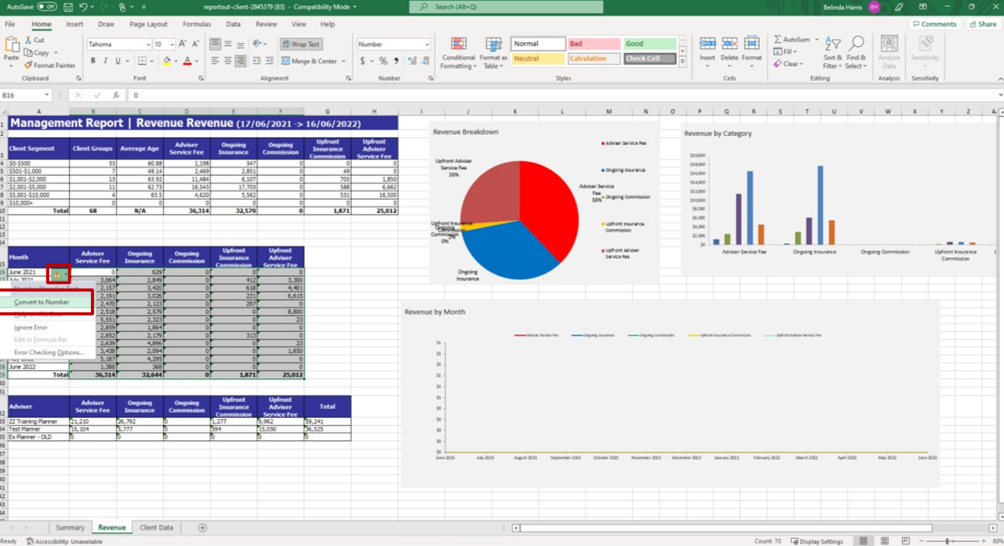
- Now click on the Revenue
We have 3 graphs that will be updated once we have edited 2 of the tables of data.
- For the first table, we need to highlight all of the cells in the content of the table including the totals, but not the dollar bands. Once the cells are highlighted, click on the little warning triangle shape and choose “Convert to Number” from the list.
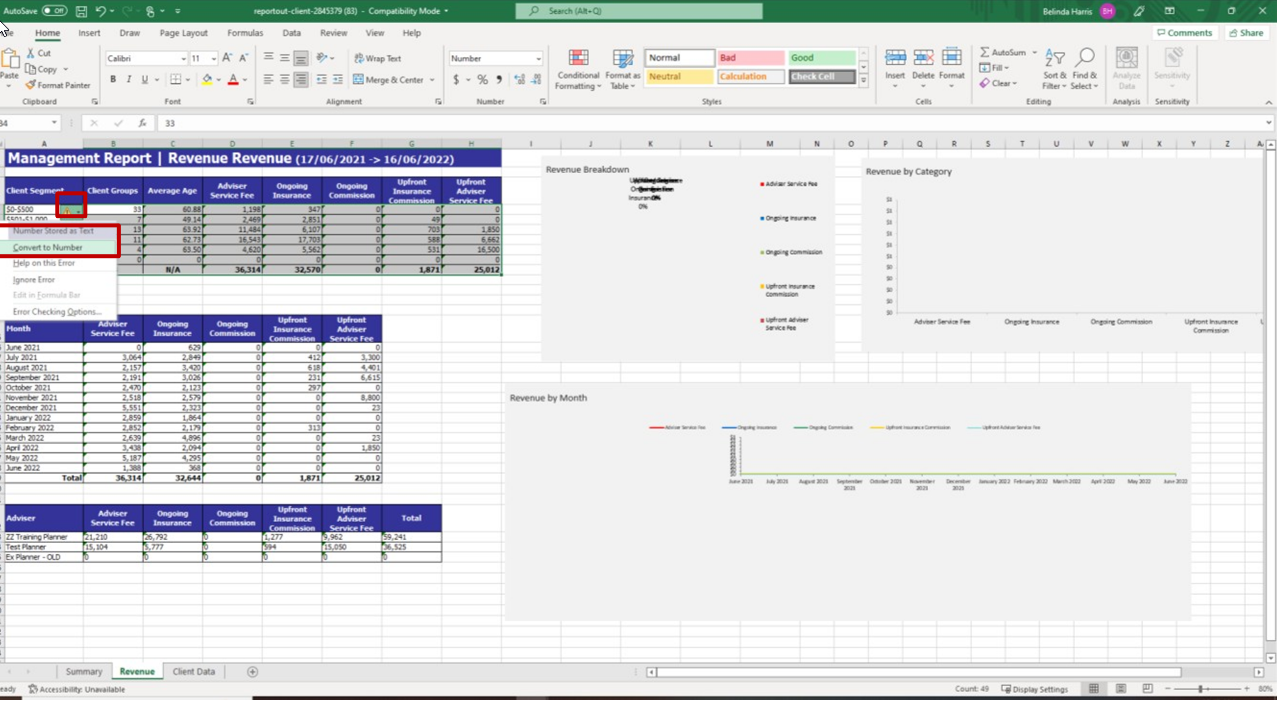

- For the 2nd table of data, again we need to highlight all of the cells in the content of the table including the totals, but not the Months. Once the cells are highlighted, click on the little warning triangle shape and choose “Convert to Number” from the list.
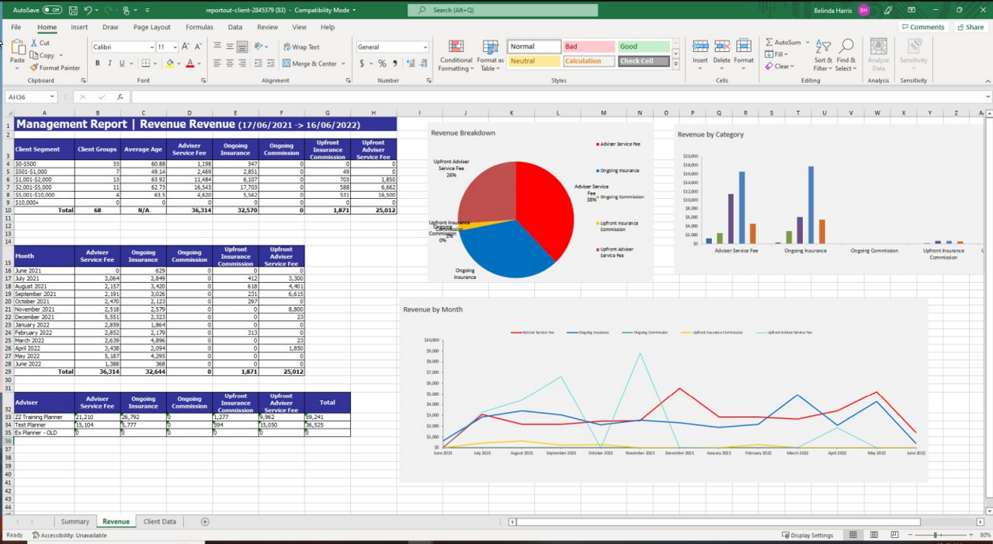
The 3 graphs will now be updated. The graphs can easily be resized by clicking on the contents and dragging them to the position or size you prefer. Legends can also be resized or shifted to suit the output of your document.
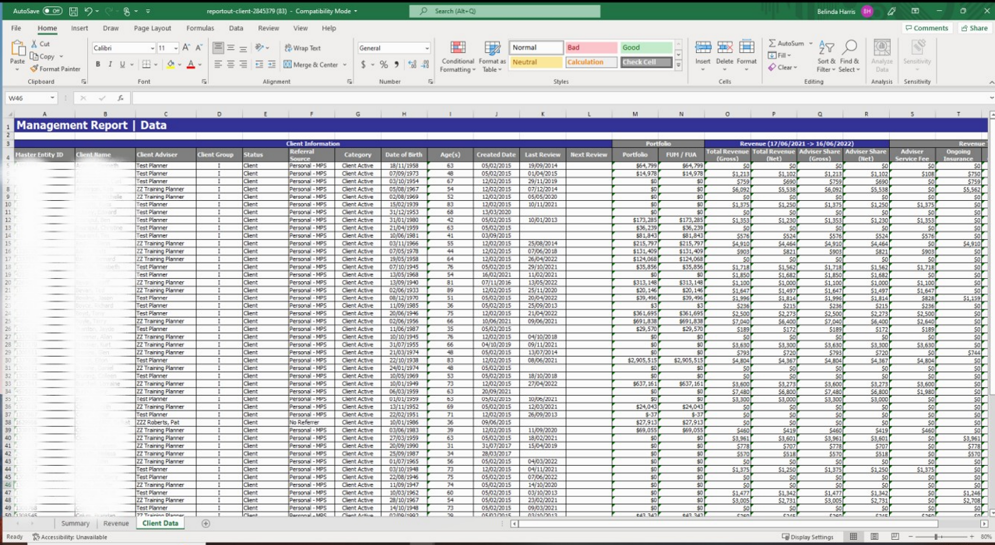
The 3rd worksheet of the Report, the Client Data tab, features the data of all of the clients included in your report. The columns of data including personal information, review details, Portfolio values and Revenue.